Text classification is a foundational problem in natural language processing (NLP), allowing us to automatically assign predefined labels to massive volumes of unstructured text. In the context of technological innovations, one of the most valuable applications of text classification is automating the assignment of International Patent Classification (IPC) hierarchies to technical documents.
Historically, this process has been a computationally expensive and time-consuming manual task. While traditional machine learning methods (like Support Vector Machines or simple Neural Networks) have been used in the past, they often require extensive feature engineering and struggle to grasp the nuanced, technical context of patent data.
To tackle this, we developed a robust, state-of-the-art methodology capable of semantically understanding technical patent abstracts and predicting their corresponding IPC labels across multiple hierarchical levels. This cross-institutional collaborative effort was led by Dr. Enrico Vanino from the University of Sheffield’s School of Economics and Prof. Carlo Corradini from the Henley Business School at University of Reading, with developer support provided by Dr. Farhad Allian from the Data Analytics Service at University of Sheffield’s IT Services, who developed the model architecture, codebase, and technical report. This post provides a look under the hood at our data processing pipeline, model architecture, and evaluation strategy used as part of this research.
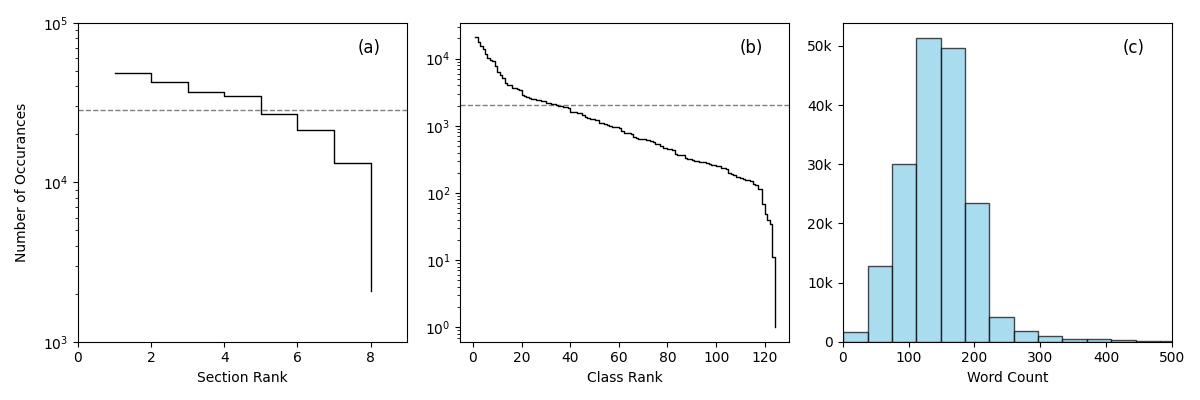
Figure 1: Corpus statistics of the PATSTAT dataset. (a) shows the label count distribution for the Section level. The dashed line shows the mean value. 50% of labels are above the mean value. (b) same as (a), but for the Class level. Only 27% of labels are above the mean value. (c) shows the word-count distribution of the abstracts.
Training any multi-label deep learning model requires a massive amount of high-quality data, especially given the hundreds of possible hierarchical IPC classifications. To build out our classification architecture, we leveraged PATSTAT, a global database containing over 130 million patent documents. By sampling 177,000 relevant patents for this research, we curated a comprehensive training dataset mapping technical abstracts to verified multi-label IPC codes (at the broader “Section” and “Class” levels). This allowed our model to learn the complex linguistic patterns associated with diverse technological domains. Figure 1 provides an overview of the corpus statistics used in our sampled training dataset, including the label distributions for the two IPC labels used in our study, and the mean word count per abstract.
As with all text classification problems, one major hurdle in patent data is the severe class imbalance. The label space is highly skewed toward dominant fields like electronics or chemistry, while niche or emerging domains remain sparsely represented. One approach is to process the data by upsampling the frequency of low-occurring labels before training the model. However, to ensure the model accurately reflects this real-world distribution, we intentionally avoided any artificially upsampling of rare labels in our approach. Instead, we relied on strict stratified sampling across our training, validation, and test splits that mimics the raw dataset’s proportions and reduces the model’s bias. This guarantees that rare technological domains are preserved and adequately represented across all phases of model development. A summary of the data splits is shown in Table 1.
| Splits | Total labels (Section) | Total labels (Class) | Average labels per patent (Section) | Average labels per patent (Class) |
|---|---|---|---|---|
| Train | 8 | 123 | 1.27 | 1.42 |
| Val | 8 | 123 | 1.26 | 1.41 |
| Test | 8 | 124 | 1.28 | 1.44 |
Table 1: Train-val-test statistics following the stratified sampling. Note that there exists more than one label per patent on average.
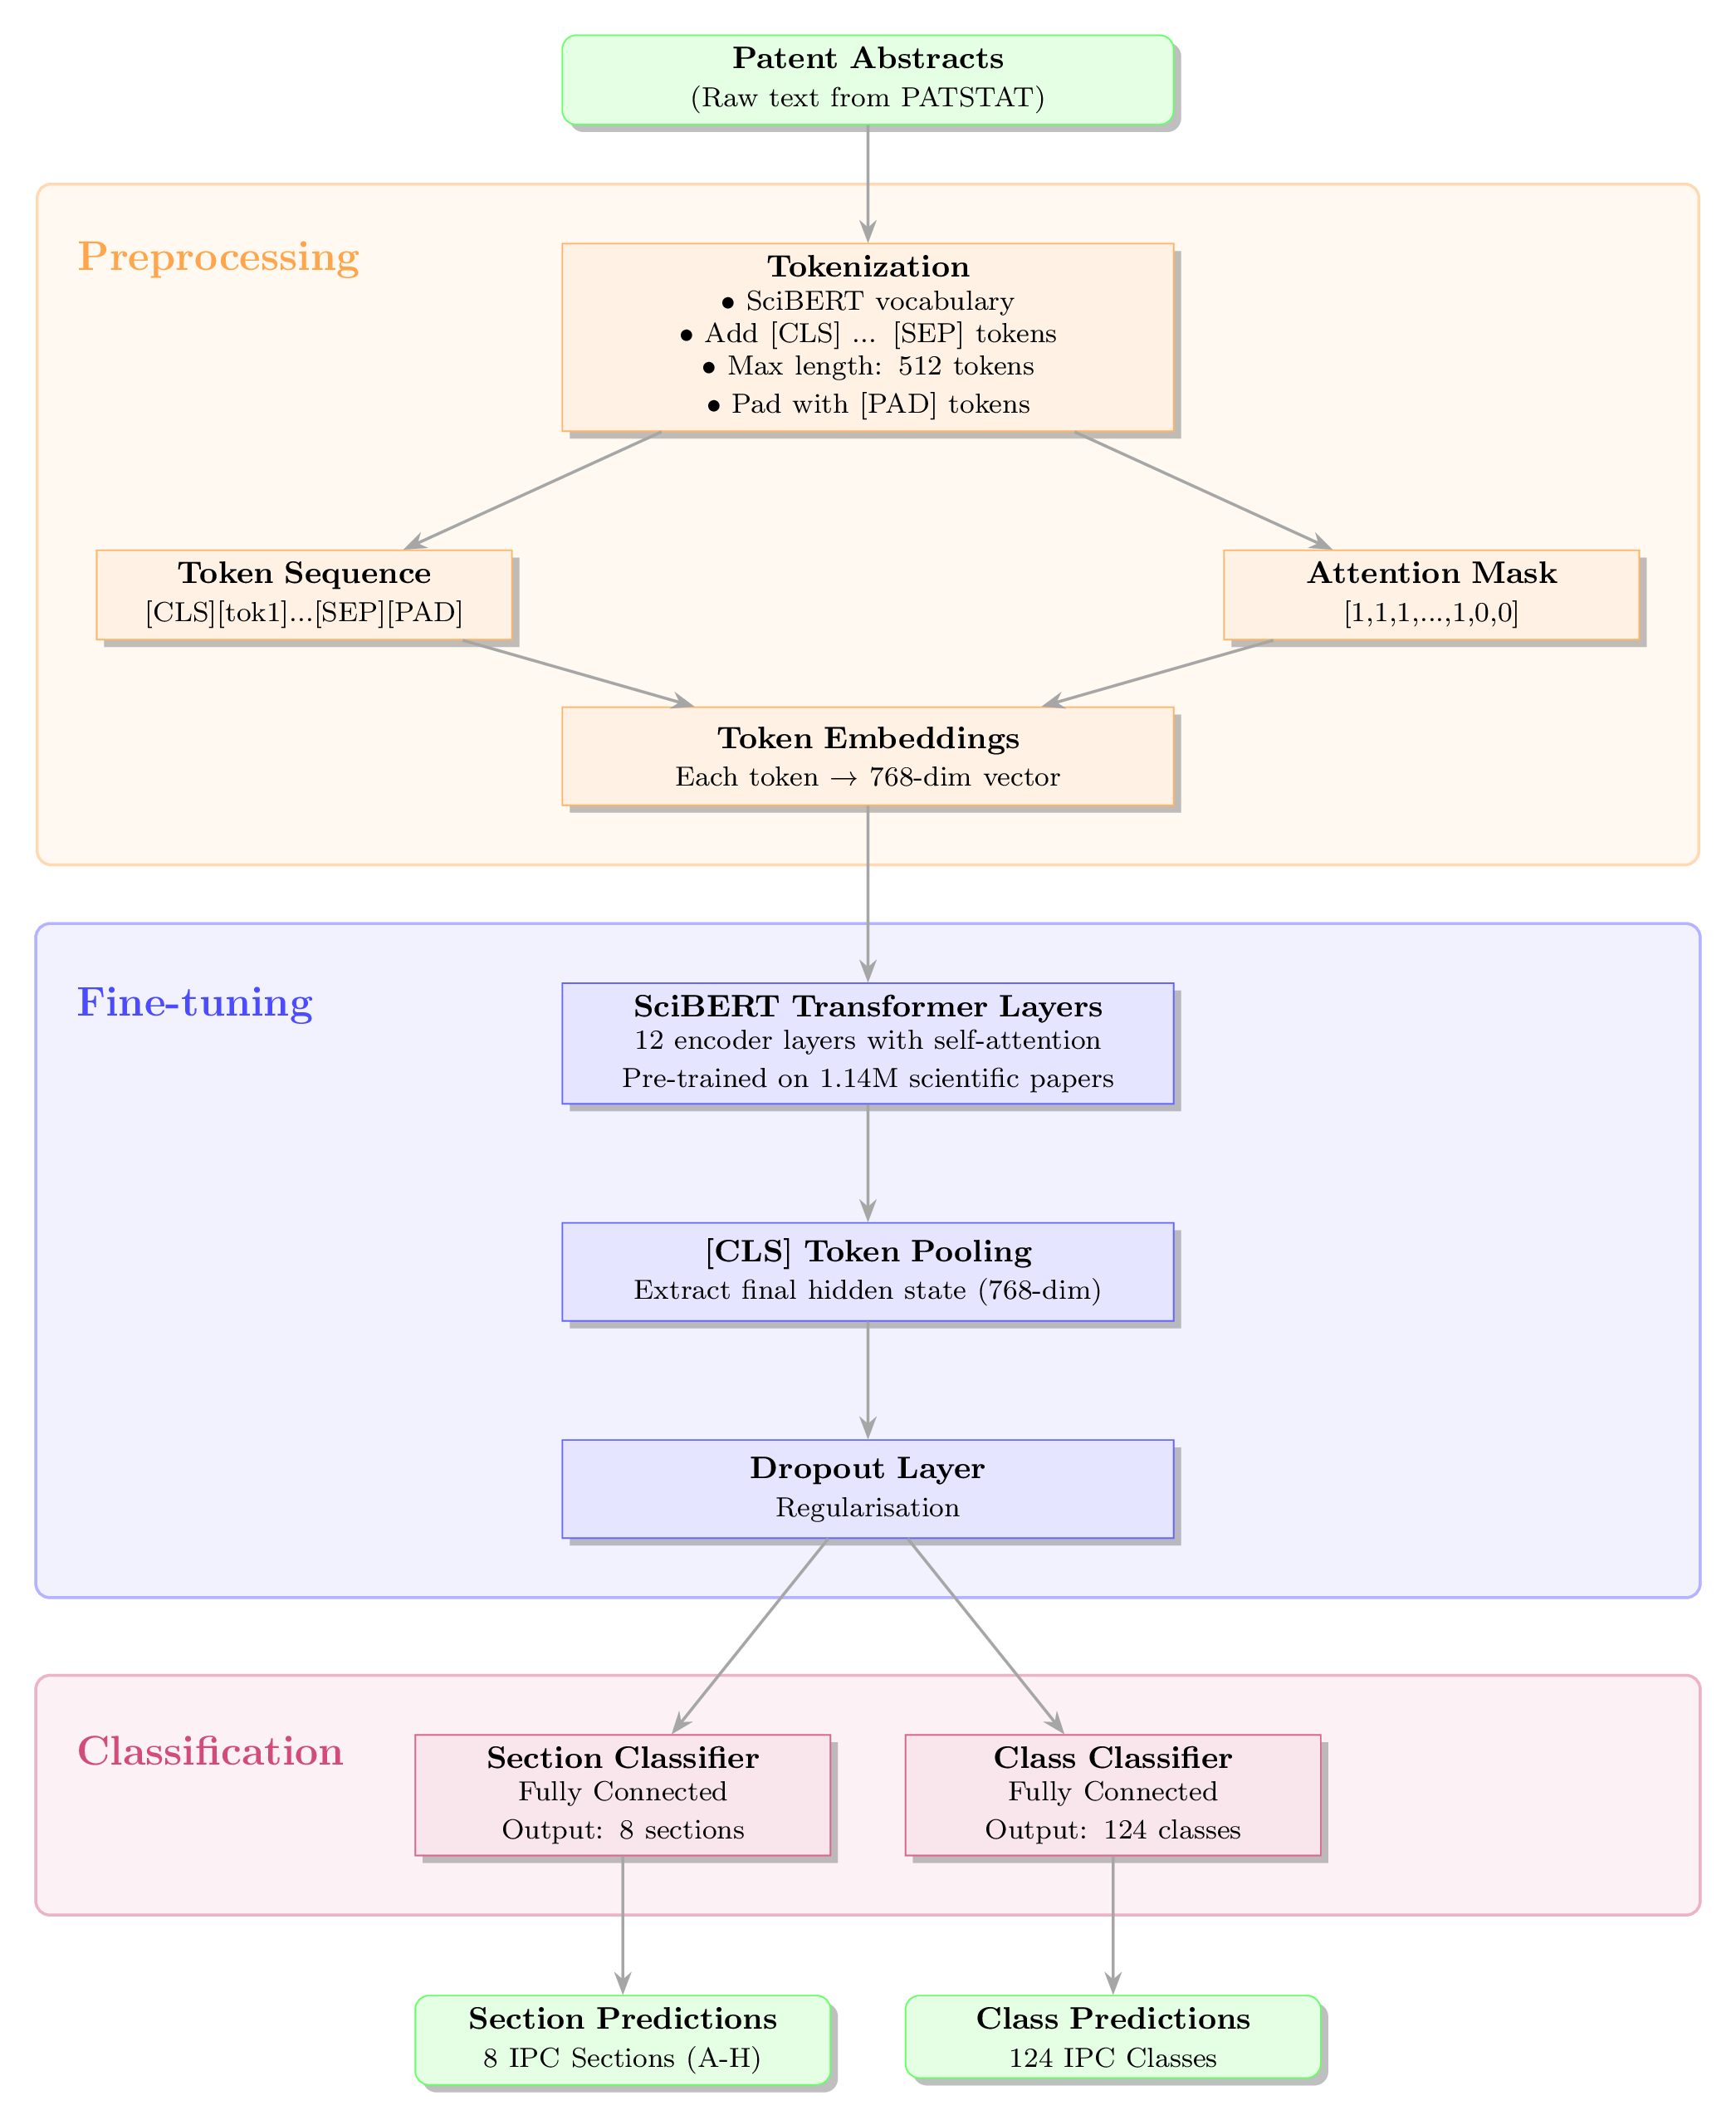
Figure 2: Schematic diagram of our workflow demonstrating the preprocessing, fine-tuning, and classification stages.
To capture the highly specialised jargon of technical abstracts, we moved beyond standard language models (like the original BERT, which is trained on general text like Wikipedia) and utilised SciBERT. SciBERT is a domain-specific transformer pre-trained on 1.14 million scientific papers, making it suitable to ingest complex, domain-specific abstracts. The architecture of our multi-label text classification pipeline involves the following three main steps:
Preprocessing: Raw abstracts are tokenised (up to a maximum sequence length of 512 tokens). Each token is mapped to
a 768-dimensional embedding vector, and the final hidden state of the classification token ([CLS]) is pooled to create a
single, dense semantic representation of the entire abstract.
Fine-tuning: The token embeddings are passed into the pre-trained SciBERT layer to perform fine-tuning. [CLS] token
pooling is performed to represent the global information of each abstract. The pooled output passes through a dropout
layer (to reduce overfitting) and feeds into two distinct, fully connected classification heads; one for predicting the
IPC “Section” (the parent level) and one for the IPC “Class” (the child level).
Predictions: Because IPC codes are strictly hierarchical, we leveraged this property and engineered the model to mask invalid parent-child combinations during predictions. For instance, if the model confidently predicts that a text belongs to Section “A”, the subsequent class predictions are constrained to only output classes that begin with “A” ( e.g., A01). This masking approach drastically reduces the effective label space (from 124 possible classes down to just the relevant ones for that section), cutting through the noise and improving the signal-to-noise ratio. The end-to-end workflow is demonstrated in Figure 2.
The model was fine-tuned to minimise a weighted combination of binary cross-entropy losses across the two hierarchical levels with respect to the frequency of IPC labels. To handle the computational load of the 110-million parameter model, training was executed using mixed-precision (FP16) on a single node equipped with dual AMD EPYC CPUs and an NVIDIA A100 GPU on Sheffield University’s HPC cluster, Stanage.
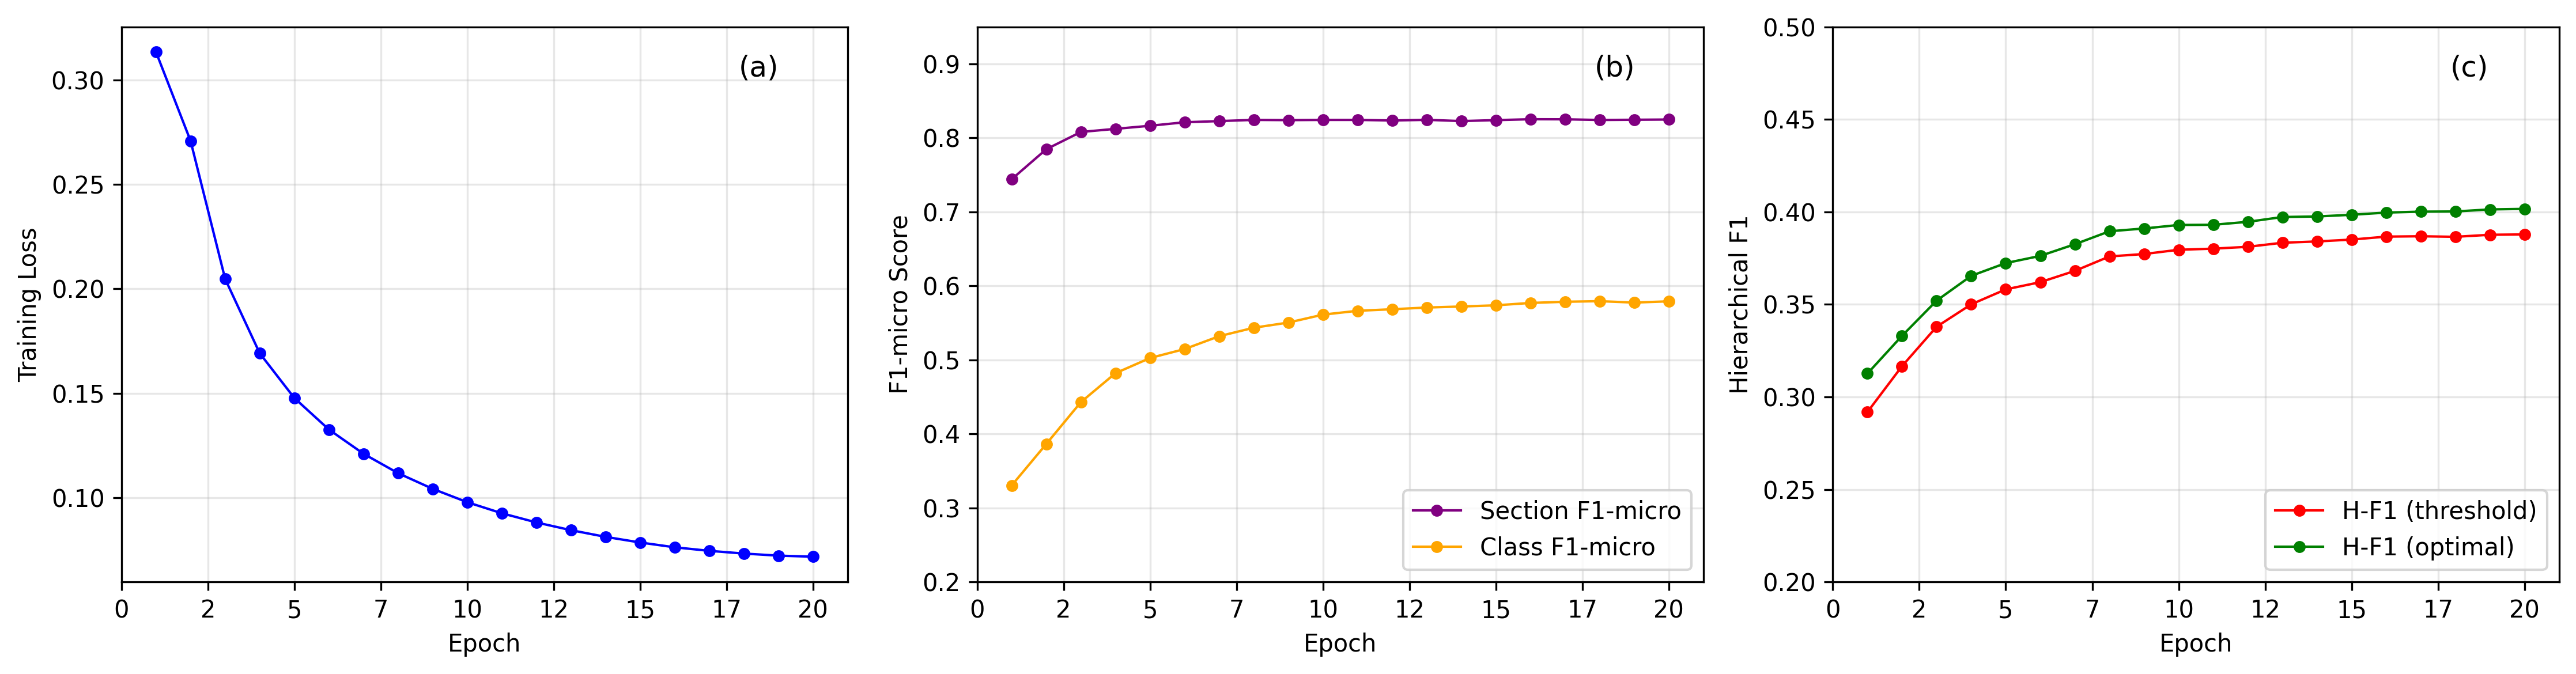
Figure 3: Training and evaluation performances of the hierarchical classifier across 20 epochs. (a) Training loss exhibits a smooth convergence. (b) Section-level F1-micro rapidly plateaus at 82% while class-level performance continues improving from 33% before stablising around 58%, highlighting the difficulty in predicting within a large label space. (c) Hierarchical F1 scores show consistent improvement with an optimisation approach providing a 3-4% gain over specified thresholds, reaching a final optimised H-F1 of 40%.
Evaluating a model trained on heavily imbalanced, hierarchical data requires looking beyond basic accuracy thresholds. During validation, we treated the task as a multi-label classification problem, looking at both micro metrics (e.g. F1-micro, which favour frequent classes) and macro metrics (e.g. F1-macro, which treat rare niche classes equally) to objectively quantify the model’s performance.
Importantly, we also implemented hierarchical metrics to expand our evaluation strategy. Standard flat metrics, such as those described above, treat all misclassifications as equally incorrect. Hierarchical metrics, however, award partial credit when predictions are taxonomically related. For instance, if the model predicts class “B01” instead of the true label “B23”, it receives partial credit because it correctly identified the broader technological domain (Section B). This proves highly valuable for mapping interdisciplinary innovations that might span multiple related fields.
| Level | F1 Micro | F1 Macro | Precision Micro | Recall Micro |
|---|---|---|---|---|
| Section | 0.8242 | 0.8061 | 0.8396 | 0.8094 |
| Class | 0.5434 | 0.1626 | 0.6063 | 0.4924 |
Table 2: Sample evaluation metrics showing the micro (frequent labels) and macro (rare labels) scores.
This work represents a significant step toward automating and improving the accuracy of patent categorisation at scale. It has the potential to enhance patent office workflows and enable more sophisticated analyses of technological landscapes. While the model currently serves as a research prototype, we envision deployment scenarios where it could assist patent examiners in preliminary classification tasks or support innovation analysts in mapping emerging technological trends across large patent portfolios. The framework’s modular design also makes it adaptable to other hierarchical text classification domains beyond patents. A publication of this work is currently in press.
While the model architecture establishes a powerful methodology for hierarchical text classification of patent data, there’s still room to grow. Future iterations of this approach can investigate advanced attention mechanisms to better exploit the hierarchical structure of IPC labels, incorporate richer technical details found in full patent claims rather than just abstracts, and explore specialised neural architectures explicitly designed to mitigate the extreme class imbalance inherent in patent classification. Hardware considerations may also play an important part in improving our approach. Training on our 177,000-document corpus required a relatively standard amount of computational resources ( e.g. Dual AMD CPUs and a NVIDIA A100 GPU), however, expanding to the full PATSTAT database of 130+ million patents would demand distributed training across multiple GPUs or even TPU clusters. Memory bottlenecks from the 768-dimensional embeddings and 110-million parameters could also be addressed through model distillation, quantisation, or even more efficient transformer variants.
This research was supported by the UK’s Economic and Social Research Council (ESRC) with the project name “Exploring the Link between Publicly Funded R&D Collaborations and Regional Technological Development” under the grant FFCoE005. A paper is currently in press.
This research was undertaken by the Data Analytics Service (DAS) team at the University of Sheffield’s IT Services. We offer free consultations, training, and technical collaboration to researchers across all Faculties.
Whether you need help with text classification, natural language processing, complex data pipelines, or machine learning, our team of Research Technical Professionals (RTPs) in the Data Analytics Service (DAS) and the Research Software Engineering Group can help.
For queries relating to collaborating with the RSE team on projects: rse@sheffield.ac.uk
Information and access to Bede.
Join our mailing list so as to be notified when we advertise talks and workshops by subscribing to this Google Group.
Queries regarding free research computing support/guidance should be raised via our Code clinic or directed to the University IT helpdesk.
List of archived pages: Archive.