

Introduction to Profiling
Last updated on 2025-03-24 | Edit this page
Estimated time: 25 minutes
Overview
Questions
- Why should you profile your code?
- How should you choose which type of profiler to use?
- Which test case should be profiled?
Objectives
- explain the benefits of profiling code and different types of profiler
- identify the appropriate Python profiler for a given scenario
- explain how to select an appropriate test case for profiling and why
Introduction
Performance profiling is the process of analysing and measuring the performance of a program or script, to understand where time is being spent during execution.
Profiling is useful when you have written any code that will be running for a substantial period of time. As your code grows in complexity, it becomes increasingly difficult to estimate where time is being spent during execution. Profiling allows you to narrow down where the time is being spent, to identify whether this is of concern or not.
Profiling is a relatively quick process which can either provide you the peace of mind that your code is efficient, or highlight the performance bottleneck. There is limited benefit to optimising components that may only contribute a tiny proportion of the overall runtime. Identifying bottlenecks allows optimisation to be precise and efficient, potentially leading to significant speedups enabling faster research. In extreme cases, addressing bottlenecks has enabled programs to run hundreds or thousands of times faster!
Increasingly, particularly with relation to HPC, attention is being paid to the energy usage of software. Profiling your software will provide you the confidence that your software is an efficient use of resources.
When to Profile
Profiling is most relevant to working code, when you have reached a stage that the code works and are considering deploying it.
Any code that will run for more than a few minutes over its lifetime and isn’t a quick one-off script can benefit from profiling.
Profiling should be a relatively quick and inexpensive process. If there are no significant bottlenecks in your code you can quickly be confident that your code is reasonably optimised. If you do identify a concerning bottleneck, further work to optimise your code and reduce the bottleneck could see significant improvements to the performance of your code and hence productivity.
All Programmers Can Benefit
Even professional programmers make oversights that can lead to poor performance, and can be identified through profiling.
For example Grand Theft Auto Online, which has allegedly earned over $7bn since it’s 2013 release, was notorious for it’s slow loading times. 8 years after it’s release a ‘hacker’ had enough, they reverse engineered and profiled the code to enable a 70% speedup!
How much revenue did that unnecessary bottleneck cost, through user churn?
How much time and energy was wasted, by unnecessarily slow loading screens?
The bottlenecked implementation was naively parsing a 10MB JSON file to create a list of unique items.
Repeatedly:
- Checking the length of (C) strings, e.g. iterating till the terminating character is found, resolved by caching the results.
- Performing a linear search of a list to check for duplicates before
inserting, resolved by using an appropriate data structure (dictionary).
- Allegedly duplicates were never even present in the JSON.
Why wasn’t this caught by one of the hundreds of developers with access to the source code?
Was more money saved by not investigating performance than committing time to profiling and fixing the issue?
Types of Profiler
There are multiple approaches to profiling, most programming languages have one or more tools available covering these approaches. Whilst these tools differ, their core functionality can be grouped into several categories.
Manual Profiling
Similar to using print() for debugging, manually timing
sections of code can provide a rudimentary form of profiling.
PYTHON
import time

t_a = time.monotonic()
# A: Do something
t_b = time.monotonic()
# B: Do something else
t_c = time.monotonic()
# C: Do another thing
t_d = time.monotonic()

mainTimer_stop = time.monotonic()
print(f"A: {t_b - t_a} seconds")
print(f"B: {t_c - t_b} seconds")
print(f"C: {t_d - t_c} seconds")
Above is only one example of how you could manually profile your Python code, there are many similar techniques.
Whilst this can be appropriate for profiling narrow sections of code, it becomes increasingly impractical as a project grows in size and complexity. Furthermore, it’s also unproductive to be routinely adding and removing these small changes if they interfere with the required outputs of a project.
Benchmarking
You may have previously used timeit
for timing Python code.
This package returns the total runtime of an isolated block of code, without providing a more granular timing breakdown. Therefore, it is better described as a tool for benchmarking.
Function-Level Profiling
Software is typically comprised of a hierarchy of function calls, both functions written by the developer and those used from the language’s standard library and third party packages.
Function-level profiling analyses where time is being spent with respect to functions. Typically, function-level profiling will calculate the number of times each function is called and the total time spent executing each function, inclusive and exclusive of child function calls.
This allows functions that occupy a disproportionate amount of the total runtime to be quickly identified and investigated.
In this course we will cover the usage of the function-level profiler
cProfile and how it’s output can be visualised with
snakeviz.
Line-Level Profiling
Function-level profiling may not always be granular enough, perhaps your software is a single long script, or function-level profiling highlighted a particularly complex function.
Line-level profiling provides greater granularity, analysing where time is being spent with respect to individual lines of code.
This will identify individual lines of code that occupy an disproportionate amount of the total runtime.
In this course we will cover the usage of the line-level profiler
line_profiler.
Deterministic vs Sampling Profilers
Line-level profiling can be particularly expensive, a program can execute hundreds of thousands of lines of code per second. Therefore, collecting information about each line of code can be costly.
line_profiler is deterministic, meaning that it tracks
every line of code executed. To avoid it being too costly, the profiling
is restricted to methods targeted with the decorator
@profile.
In contrast, scalene
is a more advanced Python profiler capable of line-level profiling. It
uses a sampling based approach, whereby the profiler halts and samples
the line of code currently executing thousands of times per second. This
reduces the cost of profiling, whilst still maintaining representative
metrics for the most expensive components.
Timeline Profiling
Timeline profiling takes a different approach to visualising where time is being spent during execution.
Typically, a subset of function-level profiling, the execution of the profiled software is instead presented as a timeline highlighting the order of function execution in addition to the time spent in each individual function call.
By highlighting individual functions calls, patterns relating to how performance scales over time can be identified. These would be hidden with the aforementioned aggregate approaches.
viztracer
is an example of a timeline profiler for Python, however we won’t be
demonstrating timeline profiling on this course.
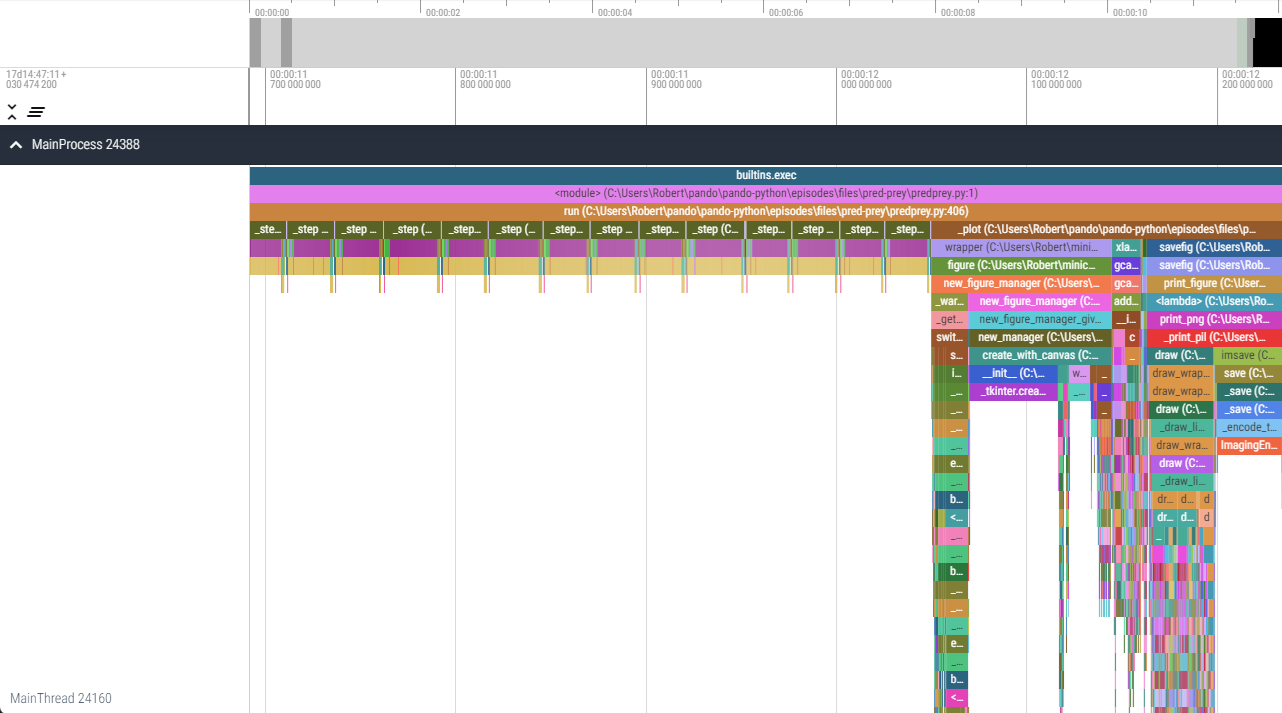
viztracer/vizviewer.Hardware Metric Profiling
Processor manufacturers typically release advanced profilers specific to their hardware with access to internal hardware metrics. These profilers can provide analysis of performance relative to theoretical hardware maximums (e.g. memory bandwidth or operations per second) and detail the utilisation of specific hardware features and operations.
Using these advanced profilers requires a thorough understanding of the relevant processor architecture and may lead to hardware specific optimisations.
Examples of these profilers include; Intel’s VTune, AMD’s uProf, and NVIDIA’s Nsight Compute.
Profiling of this nature is outside the scope of this course.
Selecting an Appropriate Test Case
The act of profiling your code, collecting additional timing metrics during execution, will cause your program to execute slower. The slowdown is dependent on many variables related to both your code and the granularity of metrics being collected.
Similarly, the longer your code runs, the more code that is being executed, the more data that will be collected. A profile that runs for hours could produce gigabytes of output data!
Therefore, it is important to select an appropriate test-case that is both representative of a typical workload and small enough that it can be quickly iterated. Ideally, it should take no more than a few minutes to run the profiled test-case from start to finish, however you may have circumstances where something that short is not possible.
For example, you may have a model which normally simulates a year in hourly time-steps. It would be appropriate to begin by profiling the simulation of a single day. If the model scales over time, such as due to population growth, it may be pertinent to profile a single day later into a simulation if the model can be resumed or configured. A larger population is likely to amplify any bottlenecks that scale with the population, making them easier to identify.
Exercise (5 minutes)
Think about a project where you’ve been working with Python. Do you know where the time during execution is being spent?
Write a short plan of the approach you would take to investigate and confirm where the majority of time is being spent during its execution.
- What tools and techniques would be required?
- Is there a clear priority to these approaches?
- Which test-case/s would be appropriate?
- Profiling is a relatively quick process to analyse where time is being spent and bottlenecks during a program’s execution.
- Code should be profiled when ready for deployment if it will be running for more than a few minutes during its lifetime.
- There are several types of profiler each with slightly different
purposes.
- function-level:
cProfile(visualised withsnakeviz) - line-level:
line_profiler - timeline:
viztracer - hardware-metric
- function-level:
- A representative test-case should be profiled, that is large enough to amplify any bottlenecks whilst executing to completion quickly.