

Line Level Profiling
Last updated on 2025-05-11 | Edit this page
Estimated time: 50 minutes
Overview
Questions
- When is line level profiling appropriate?
- What adjustments are required to Python code to profile with
line_profiler? - How can
kernprofbe used to profile a Python program?
Objectives
- decorate Python code to prepare it for profiling with
line_profiler - execute a Python program via
kernprofto collect profiling information about a Python program’s execution - interpret output from
line_profiler, to identify the lines where time is being spent during a program’s execution
Introduction
Whilst profiling, you may find that function-level profiling highlights expensive methods where you can’t easily determine the cause of the cost due to their complexity.
Line level profiling allows you to target specific methods to collect more granular metrics, which can help narrow the source of expensive computation further. Typically, line-level profiling will calculate the number of times each line is called and the total time spent executing each line. However, with the increased granularity come increased collection costs, which is why it’s targeted to specific methods.
This allows lines that occupy a disproportionate amount of the total runtime to be quickly identified and investigated.
In this episode we will cover the usage of the line-level profiler
line_profiler, how your code should be modified to target
the profiling and how the output can be interpreted.
line_profiler
line_profiler
is a line-level profiler which provides both text output and
visualisation.
It is not part of the Python standard library, and therefore must be installed via pip.
To use line_profiler decorate methods to be profiled
with @profile which is imported from
line_profiler.
For example, the below code:
PYTHON
def is_prime(number):
    if number < 2:
        return False
    for i in range(2, int(number**0.5) + 1):
        if number % i == 0:
            return False
    return True

print(is_prime(1087))
Would be updated to:
PYTHON
from line_profiler import profile

@profile
def is_prime(number):
    if number < 2:
        return False
    for i in range(2, int(number**0.5) + 1):
        if number % i == 0:
            return False
    return True

print(is_prime(1087))
This tells line_profiler to collect metrics for the
lines within the method is_prime(). You can still execute
your code as normal, and these changes will have no effect.
Similar to the earlier tools, line_profiler can then be
triggered via kernprof.
This will output a table per profiled method to console:
OUTPUT
Wrote profile results to my_script.py.lprof
Timer unit: 1e-06 s

Total time: 1.65e-05 s
File: my_script.py
Function: is_prime at line 3

Line #      Hits         Time  Per Hit   % Time  Line Contents
==============================================================
     3                                           @profile
     4                                           def is_prime(number):
     5         1          0.4      0.4      2.4      if number < 2:
     6                                                   return False
     7        32          8.4      0.3     50.9      for i in range(2, int(number**0.5) + 1):
     8        31          7.4      0.2     44.8          if number % i == 0:
     9                                                       return False
    10         1          0.3      0.3      1.8      return True
The columns have the following definitions:
| Column | Definition |
|---|---|
Line # |
The line number of the relevant line within the file (specified above the table). |
Hits |
The total number of times the line was executed. |
Time |
The total time spent executing that line, including child function calls. |
Per Hit |
The average time per call, including child function calls
(Time/Hits). |
% Time |
The time spent executing the line, including child function calls, relative to the other lines of the function. |
Line Contents |
A copy of the line from the file. |
As line_profiler must be attached to specific methods
and cannot attach to a full Python file or project, if your Python file
has significant code in the global scope it will be necessary to move it
into a new method which can then instead be called from global
scope.
The profile is also output to file, in this case
my_script.py.lprof. This file is not human-readable, but
can be printed to console by passing it to line_profiler,
which will then display the same table as above.
Worked Example
Follow Along
Download the Python source for the example and follow along with the worked example on your own machine.
To more clearly demonstrate how to use line_profiler,
the below implementation of “FizzBuzz” will be line profiled.
PYTHON
n = 100
for i in range(1, n + 1):
    if i % 3 == 0 and i % 5 == 0:
        print("FizzBuzz")
    elif i % 3 == 0:
        print("Fizz")
    elif i % 5 == 0:
        print("Buzz")
    else:
        print(i)
As there are no methods, firstly it should be updated to move the code to be profiled into a method:
PYTHON
def fizzbuzz(n):
    for i in range(1, n + 1):
        if i % 3 == 0 and i % 5 == 0:
            print("FizzBuzz")
        elif i % 3 == 0:
            print("Fizz")
        elif i % 5 == 0:
            print("Buzz")
        else:
            print(i)

fizzbuzz(100)
Next the method can be decorated with @profile which
must be imported via line_profiler:
PYTHON
from line_profiler import profile

@profile
def fizzbuzz(n):
    for i in range(1, n + 1):
        if i % 3 == 0 and i % 5 == 0:
            print("FizzBuzz")
        elif i % 3 == 0:
            print("Fizz")
        elif i % 5 == 0:
            print("Buzz")
        else:
            print(i)

fizzbuzz(100)
Now that the code has been decorated, it can be profiled!
This will output a table per profiled method to console:
If you run this locally it should be highlighted due to
-r passed to kernprof.
OUTPUT
Wrote profile results to fizzbuzz.py.lprof
Timer unit: 1e-06 s

Total time: 0.0021535 s
File: fizzbuzz.py
Function: fizzbuzz at line 3

Line #      Hits         Time  Per Hit   % Time  Line Contents
==============================================================
     3                                           @profile
     4                                           def fizzbuzz(n):
     5       101         32.5      0.3      1.5      for i in range(1, n + 1):
     6       100         26.9      0.3      1.2          if i % 3 == 0 and i % 5 == 0:
     7         6        125.8     21.0      5.8              print("FizzBuzz")
     8        94         16.7      0.2      0.8          elif i % 3 == 0:
     9        27        541.3     20.0     25.1              print("Fizz")
    10        67         12.4      0.2      0.6          elif i % 5 == 0:
    11        14        285.1     20.4     13.2              print("Buzz")
    12                                                   else:
    13        53       1112.8     21.0     51.7              print(i)
For this basic example, we can calculate that “FizzBuzz” would be
printed 6 times out of 100, and the profile shows that line 7
(print("FizzBuzz")) occupied 5.8% of the runtime. This is
slightly lower than 6% due to the control flow code (printing to console
is expensive relative to the control flow and conditional statements).
Similarly, “Fizz” is printed 27 times and occupies 25.1%, likewise
“Buzz” is printed 14 times and occupies 13.2%. Each print statement has
a similar “Per Hit” time of 20-21 micro seconds.
Therefore it can be seen in this example, how the time spent executing each line matches expectations.
Rich Output
The -r argument passed to kernprof (or
line_profiler) enables rich output, if you run the profile
locally it should look similar to this. This requires the optional
package rich, it will have been installed if
[all] was specified when installing
line_profiler with pip.
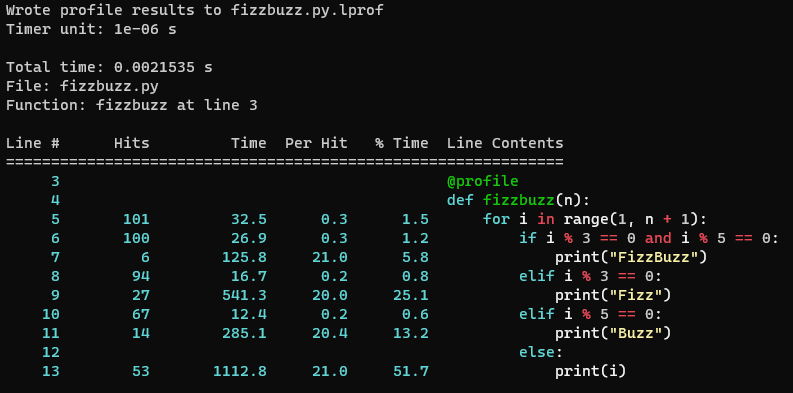
line_profiler for the above FizzBuzz profile code.line_profiler Inside Notebooks
If you’re more familiar with writing Python inside Jupyter notebooks
you can, as with snakeviz, use line_profiler
directly from inside notebooks. However, it is still necessary for the
code you wish to profile to be placed within a function.
First line_profiler must be installed and it’s extension
loaded.
Following this, you call line_profiler with
%lprun.
The functions to be line profiled are specified with
-f <function name>, this is repeated for each
individual function that you would otherwise apply the
@profile decorator to.
This is followed by calling the function which runs the full code to be profiled.
For the above FizzBuzz example it would be:
This will then create an output cell with any output from the
profiled code, followed by the standard output from
line_profiler. It is not currently possible to get the
rich/coloured output from line_profiler within
notebooks.
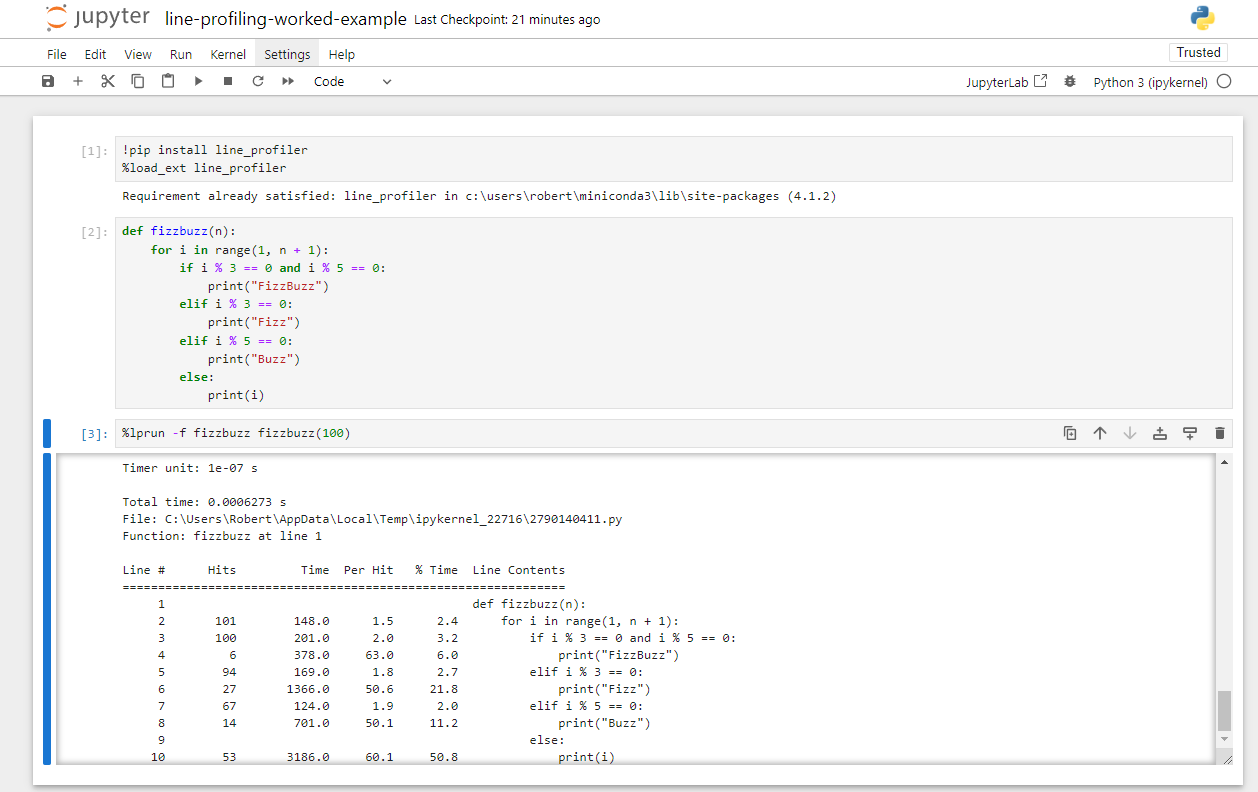
line_profiler
inside a Juypter notebook for the above FizzBuzz profile code.Exercises
The following exercises allow you to review your understanding of what has been covered in this episode.
Exercise 1: BubbleSort
Download and profile the Python bubblesort implementation, line-level profile the code to investigate where time is being spent.
Bubblesort is a basic sorting algorithm, it is not considered to be efficient so in practice other sorting algorithms are typically used.
The array to be sorted is iterated, with a pair-wise sort being applied to each element and it’s neighbour. This can cause elements to rise (or sink) multiple positions in a single pass, hence the name bubblesort. This iteration continues until the array is fully iterated with no elements being swapped.
The program can be executed via
python bubblesort.py <elements>. The value of
elements should be a positive integer as it represents the
number of elements to be sorted.
- Remember that the code needs to be moved into a method decorated
with
@profile - This must be imported via
from line_profiler import profile - 100 elements should be suitable for a quick profile
If you chose to profile the whole code, it may look like this:
PYTHON
import sys
import random
from line_profiler import profile        # Import profile decorator

@profile                                 # Decorate the function to be profiled
def main():                              # Create a simple function with the code to be profiled
    # Argument parsing
    if len(sys.argv) != 2:
        print("Script expects 1 positive integer argument, %u found."%(len(sys.argv) - 1))
        sys.exit()
    n = int(sys.argv[1])
    # Init
    random.seed(12)
    arr = [random.random() for i in range(n)]
    print("Sorting %d elements"%(n))
    # Sort
    for i in range(n - 1):
        swapped = False
        for j in range(0, n - i - 1):
            if arr[j] > arr[j + 1]:
                arr[j], arr[j + 1] = arr[j + 1], arr[j]
                swapped = True
        # If no two elements were swapped in the inner loop, the array is sorted
        if not swapped:
            break
    # Validate
    is_sorted = True
    for i in range(n - 1):
        if arr[i] > arr[i+1]:
            is_sorted = False
    print("Sorting: %s"%("Passed" if is_sorted else "Failed"))

main()                                  # Call the created function
The sort can be profiled with 100 elements, this is quick and should be representative.
This produces output:
OUTPUT
Wrote profile results to bubblesort.py.lprof
Timer unit: 1e-06 s

Total time: 0.002973 s
File: bubblesort.py
Function: main at line 5

Line #      Hits         Time  Per Hit   % Time  Line Contents
==============================================================
     5                                           @profile
     6                                           def main():
     7                                               # Argument parsing
     8         1          0.7      0.7      0.0      if len(sys.argv) != 2:
     9                                                   print("Script expects 1 positive integer argument, %u found."%…
    10                                                   sys.exit()
    11         1          1.6      1.6      0.1      n = int(sys.argv[1])
    12                                               # Init
    13         1          8.8      8.8      0.3      random.seed(12)
    14         1         16.6     16.6      0.6      arr = [random.random() for i in range(n)]
    15         1         38.2     38.2      1.3      print("Sorting %d elements"%(n))
    16                                               # Sort
    17        95         14.5      0.2      0.5      for i in range(n - 1):
    18        95         13.1      0.1      0.4          swapped = False
    19      5035        723.1      0.1     24.3          for j in range(0, n - i - 1):
    20      4940       1045.9      0.2     35.2              if arr[j] > arr[j + 1]:
    21      2452        686.9      0.3     23.1                  arr[j], arr[j + 1] = arr[j + 1], arr[j]
    22      2452        353.0      0.1     11.9                  swapped = True
    23                                                   # If no two elements were swapped in the inner loop, the array…
    24        95         15.2      0.2      0.5          if not swapped:
    25         1          0.2      0.2      0.0              break
    26                                               # Validate
    27         1          0.5      0.5      0.0      is_sorted = True
    28       100         12.9      0.1      0.4      for i in range(n - 1):
    29        99         20.3      0.2      0.7          if arr[i] > arr[i+1]:
    30                                                       is_sorted = False
    31         1         21.5     21.5      0.7      print("Sorting: %s"%("Passed" if is_sorted else "Failed"))
From this we can identify that the print statements were the most expensive individual calls (“Per Hit”), however both were only called once. Most execution time was spent at the inner loop (lines 19-22).
As this is a reference implementation of a classic sorting algorithm we are unlikely to be able to improve it further.
Download the pre-generated line_profiler output, this
can be opened be to save waiting for the profiler.
Exercise 2: Predator Prey
During the function-level profiling episode,
the Python predator prey
model was function-level profiled. This highlighted that
Grass::eaten() (from predprey.py:278) occupies
the majority of the runtime.
Line-profile this method, using the output from the profile consider how it might be optimised.
- Remember that the function needs to be decorated with
@profile - This must be imported via
from line_profiler import profile - Line-level profiling
Grass::eaten(), the most called function will slow it down significantly. You may wish to reduce the number of stepspredprey.py:305.
First the function must be decorated
line_profiler can then be executed via
python -m kernprof -lvr predprey.py <steps>.
Since this will take much longer to run due to
line_profiler, you may wish to profile fewer
steps than you did in the function-level profiling exercise
(250 was suggested for a full run). In this instance it may change the
profiling output slightly, as the number of Prey and their
member variables evaluated by this method both change as the model
progresses, but the overall pattern is likely to remain similar.
Alternatively, you can kill the profiling process
(e.g. ctrl + c) after a minute and the currently collected
partial profiling information will be output.
This will produce output similar to that below.
OUTPUT
Wrote profile results to predprey.py.lprof
Timer unit: 1e-06 s

Total time: 101.573 s
File: predprey.py
Function: eaten at line 278

Line #      Hits         Time  Per Hit   % Time  Line Contents
==============================================================
   278                                               @profile
   279                                               def eaten(self, prey_list):
   280   1250000     227663.1      0.2      0.2          if self.available:
   281   1201630     165896.4      0.1      0.2              prey_index = -1
   282   1201630     166219.0      0.1      0.2              closest_prey = GRASS_EAT_DISTANCE
   283
   284                                                       # Iterate prey_location messages to find the closest prey
   285 198235791   29227902.1      0.1     28.8              for i in range(len(prey_list)):
   286 197034161   30158318.8      0.2     29.7                  prey = prey_list[i]
   287 197034161   38781451.1      0.2     38.2                  if prey.life < PREY_HUNGER_THRESH:
   288                                                               # Check if they are within interaction radius
   289   2969470     579923.4      0.2      0.6                      dx = self.x - prey.x
   290   2969470     552092.2      0.2      0.5                      dy = self.y - prey.y
   291   2969470     938669.8      0.3      0.9                      distance = math.sqrt(dx*dx + dy*dy)
   292
   293   2969470     552853.8      0.2      0.5                      if distance < closest_prey:
   294      2532        469.3      0.2      0.0                          prey_index = i
   295      2532        430.1      0.2      0.0                          closest_prey = distance
   296
   297   1201630     217534.5      0.2      0.2              if prey_index >= 0:
   298                                                           # Add grass eaten message
   299      2497       2181.8      0.9      0.0                  prey_list[prey_index].life += GAIN_FROM_FOOD_PREY
   300
   301                                                           # Update grass agent variables
   302      2497        793.9      0.3      0.0                  self.dead_cycles = 0
   303      2497        631.0      0.3      0.0                  self.available = 0
From the profiling output it can be seen that lines 285-287 occupy over 90% of the method’s runtime!
Given that the following line 289 only has a relative 0.6% time, it
can be understood that the vast majority of times the condition
prey.life < PREY_HUNGER_THRESH is evaluated it does not
proceed.
Remembering that this method is executed once per each of the 5000
Grass agents each step of the model, it could make sense to
pre-filter prey_list once each time-step before it is
passed to Grass::eaten(). This would greatly reduce the
number of Prey iterated, reducing the cost of the
method.
- Specific methods can be line-level profiled if decorated with
@profilethat is imported fromline_profiler. -
kernprofexecutesline_profilerviapython -m kernprof -lvr <script name> <arguments>. - Code in global scope must be wrapped in a method if it is to be
profiled with
line_profiler. - The output from
line_profilerlists the absolute and relative time spent per line for each targeted function.